
Mapping Software

The County is providing a free, web-based, mapping software so that individuals and community groups can participate in the redistricting process. The online software is available for use by the public to prepare and submit Redistricting Plans for the CRC’s consideration.
If you would like to report an error or if you are in need of personalized help with the mapping software, please email tle@crc.lacounty.gov. Personalized help is available in English, Spanish, Mandarin, Farsi, Hindi, Korean, and Vietnamese. Interpreters will be provided for additional languages.
TRAINING:
- Priti Mathur from ARCBridge held a free public workshop on “How to Use Redistricting Mapping Software” on Thursday, September 9, 11:00 am (PST). Click here to view the recording.
- The same training occurred virtually in Spanish on Friday, October 8, 9:30 am (PST) by County GIS experts Alma Vazquez, Ricardo Contreras, and Juan-Raul Cardenas. Click here to view the recording.
- Priti Mathur from ARCBridge held an additional free public workshop on “How to Use Redistricting Mapping Software” on Thursday, October 14, 11:00 am (PST). Click here to view the recording.
UPDATE: P.L. 94-171 redistricting data is a tabulation from the decennial census that includes counts of population by race and ethnicity (Hispanic or Latino origin); voting age; housing occupancy status; and group quarter s population, all at the census block level. The California Citizens Redistricting Commission and many local jurisdictions, including cities and counties are required by law to use the official redistricting dataset provided by the Statewide Database. This dataset is different form the data that the U.S. Census Bureau provides in that it has reallocated data from incarcerated person that were enumerated in facilities under the control of the California Department of Corrections and Rehabilitation to their last known residential address. This dataset is released on 2020 Census Block Geography. Click here to view the report prepared by the GIS-Demography Team in the County of Los Angeles Internal Services Department (ISD) on how the incarcerated data adjustments changed the dataset.
SUBMITTED MAPS AND PLANS: Members of the public are able to view submitted maps and plans in the Redistricting Hub. Members of the public interested in exploring the submitted plans in more detail (e.g., location of cities and communities in relation to proposed Supervisorial Districts) can view the submitted plans in the Redistricting Mapping Software. Click here for a video demonstration on how to open submitted plans on the mapping software.
How to Create and Submit Redistricting Plans
Creating and submitting a map is now possible through a free, web-based, mapping tool developed by Esri. Below are steps and videos to help you get started on developing maps and plans for the Commission to consider:
- Click here to access the redistricting mapping tool. Alternatively, copy and paste into your web browser: https://redistricting-lacounty.esriemcs.com/redistricting/index.html.
- Click on “Create an account” and enter in your name, email, the username you would like, and a password.
- Click “Sign in To Portal for ArcGIS” to log in with your new username and password.
- Select which template you would like to start with:
- Current Supervisorial Districts (2011) – Begin with a map of the current five (5) Supervisorial Districts. This is the suggested template for users who may want to make minor changes to the existing Supervisorial Districts, including moving one community to another bordering Supervisorial District.
- Blank Template – Begin with a blank template to create and submit a map with five (5) Supervisorial Districts. This is the suggested template for users who may want to make changes that differ substantially from the current Supervisorial Districts.
- Communities of Interest Template – Begin with a blank template to create and submit a map with one (1) designated area of interest. This is the suggested template for users who want to identify a community or area that should be kept together without having to submit a map with five (5) Supervisorial Districts.
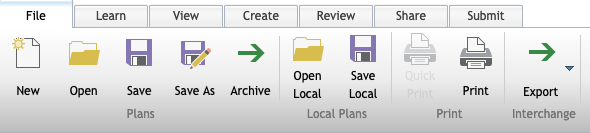
- Click the “File” tab to save or open a plan. To save a new plan, click on the “Save As” button to save your new plan. Enter in a file name (e.g., LastName_Date) and description. Click here to watch a video demonstration.
- Click the “Learn” tab and read additional details on what each tab can do.
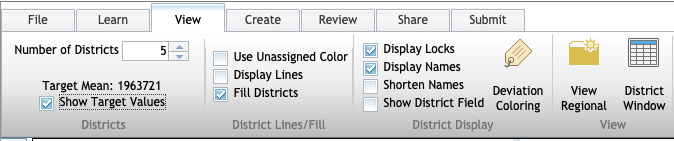
- Click the “View” tab and select your preferred display options, including how lines, districts, and names are displayed. Selecting “Show Target Values” under the “View” tab will add a column in your data window with the approximate number of people each district should have. Click here to watch a video demonstration.
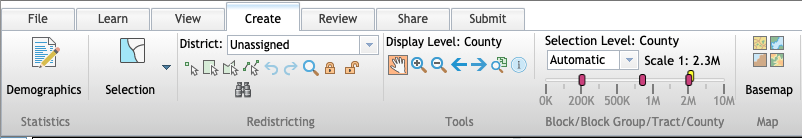
- Click the “Create” tab to add demographic data and start using tools to draw districts and communities of interest. In this tab, you can select different drawing tools in the “Redistricting” section. This includes drawing tools that select one geography at a time, select multiple geographies by rectangle, select multiple geographies by polygon, or select multiple geographies by line. To designate areas to a certain district, select the “District” drop-down menu in the “Redistricting” section then select the areas you would like to designate to the selected district. You can zoom in to see smaller geographical areas which you can select and assign a district. Click here to watch a video demonstration.
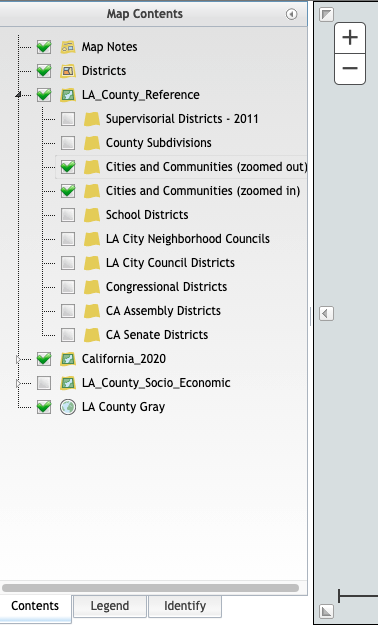
- If you would like to view the borders for whole cities and places in the county, explore the “Map Contents” window. You can do this by clicking on the gray triangle button immediately left of the + and – zoom keys in the map window to expand the “Map Contents” area. In this “Map Contents” area, you can add additional layers for Los Angeles County (e.g., Cities and Communities; CVAP) by checking the box next to “LA_County_Reference,” clicking the triangle icon immediately left of the check box for “LA_County_Reference” to expand your options further, then checking the box for the additional layers and lines you would like. Click here to watch a video demonstration.
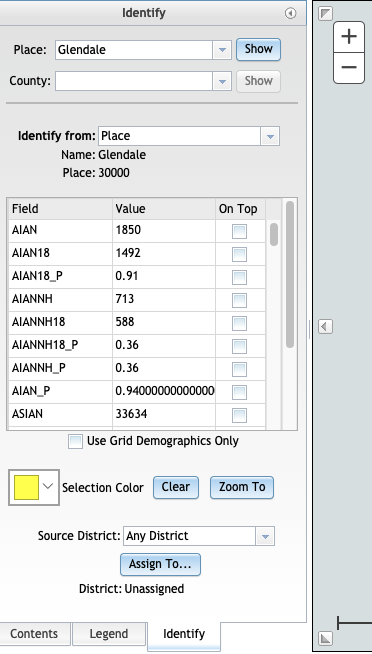
- If you would like to assign whole cities and places to districts, use the “Identify” window. You can do this by clicking on the “Identify” tab at the bottom of the “Map Contents” window discussed in the previous step. Once in the “Identify” window, use the drop-down menu for “Place” to find and select a city or place in Los Angeles County. Click on the “Show” button next to the drop-down menu once you select the place. This will show you your selected city or place on the map. In the “Identify” window, you will be able to see all the demographic information for your selected city or place. To assign the selected city or place to a specific district, select the district you would like the city to under the “Create” tab (see step 8) then click on the “Assign To…” button in the “Identify” window. Click here to watch a video demonstration.
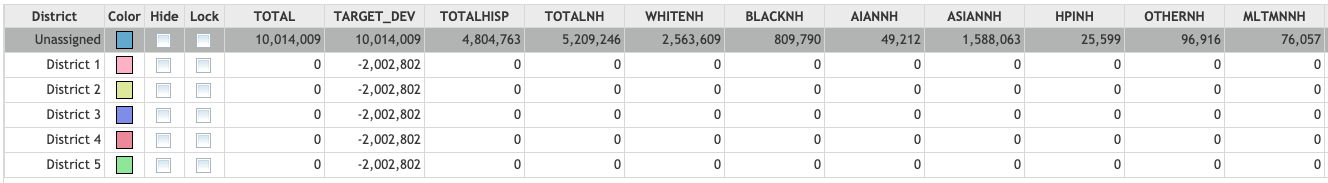
- Check the data window below the map window to see if your districts meet the target deviation. Each district should have approximately equal population (approximately 2,002,802 people) with a maximum deviation of 10% (approximately 200,280 people). In this data window, you can also check the racial/ethnic makeup of each district you drew.
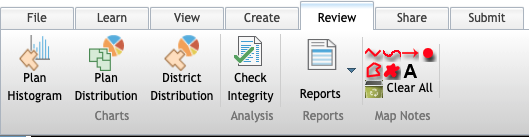
- Click the “Review” tab to see if your plan meets the requirements for submission. Click on the “Check Integrity” button in the “Analysis” section to run the integrity tests. Your plan must meet all the checks before submitting. If your plan does not meet one or more of the checks, you can click on the “Details” button next to the check to see why your plan did not meet that requirement. Click here to watch a video demonstration on running integrity checks.
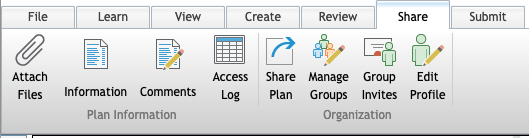
- Click on the “Share” tab if you would like to share your plan with known colleagues and other members of the public. Click here to watch a video demonstration on how to share a plan. In this tab, you can additionally attach files or include information and comments about your plan. Click here to watch a video demonstration on attaching files and including comments.
- Click the “Submit” tab and click “Submit Plan” to submit your finished plan. The plan will only be submitted if it passes the integrity test detailed in step 10.
Additional Tips:
- Hover your cursor (without clicking) over any button or icon and a small window will appear with a short description on what that button or icon does.
- Save often by either clicking the “Save” icon in the “File” tab or clicking the floppy disk icon in the top tool bar in orange.
- You can change the basemap by clicking on the “Create” tab then the “Basemap” button under the “Map” section. This will allow you to change the underlying map. Options include a topographic map and streets map.
- You can zoom in and out by using your mouse wheel or clicking on the + and – icon on the top left corner of your map screen.
- You can use the “Identify” tool under the “Create” tab to examine specific geographies (e.g., blockgroups) and assign them individually to specific districts. Click here to watch a video demonstration.
- You can use the “Select by Attributes” under the “Create” tab to identify geographies that meet certain criteria (e.g., racial/ethnic percentage makeup) to then designate to specific districts. You can use the “Select by Location” tool under the “Create” tab to specify locations (e.g., neighborhoods) you can select to designate to specific districts. Click here to watch a video demonstration.
- If you would like to export your map to your local computer, you can do so by clicking the “File” tab then clicking the “Export.” You can export your map and plan as different file types, including as an image, fixed text format, or shapefile. Click here to watch a video demonstration on exporting and importing fixed text format files. Additional instructions here. Click here to watch a video demonstration on exporting and importing shapefiles.
- In the “Review” tab, you can generate reports to examine various data points, such as voting age population breakdown. Click here to watch a video demonstration on generating reports.
- Users can open, save as their own, and modify plans that have been shared with them. Click here to watch a video demonstration on how to open a shared plan and add reference layers.
- Users can switch district names and numbers by using the “Swap Districts” function under the “View” tab. Click here for more instructions on how.
- For more help or if you have additional questions, please email tle@crc.lacounty.gov
Additional Resources:
- StoryMap: What is Redistricting?
- Video: Bring Clarity to Redistricting with Esri Technology Webinar
- Thematic Maps of Los Angeles County’s Racial/Ethnic Communities by ARCBridge
- CVAP (Citizen Voting Age Population) Data Dictionary. Note: CVAP data and layer is reference information from ACS data 2015-2019 as it is not required for redistricting. CVAP data is based on sample data and is available only down to the block group level. The state has assigned the CVAP data to the block level. VAP (Voting Age Population) is available and part of the PL (Public Law) data.
 Carlos de Alba, Director of Media Strategy


 Commissioner Mary Kenney